Regional recession/ascension rates
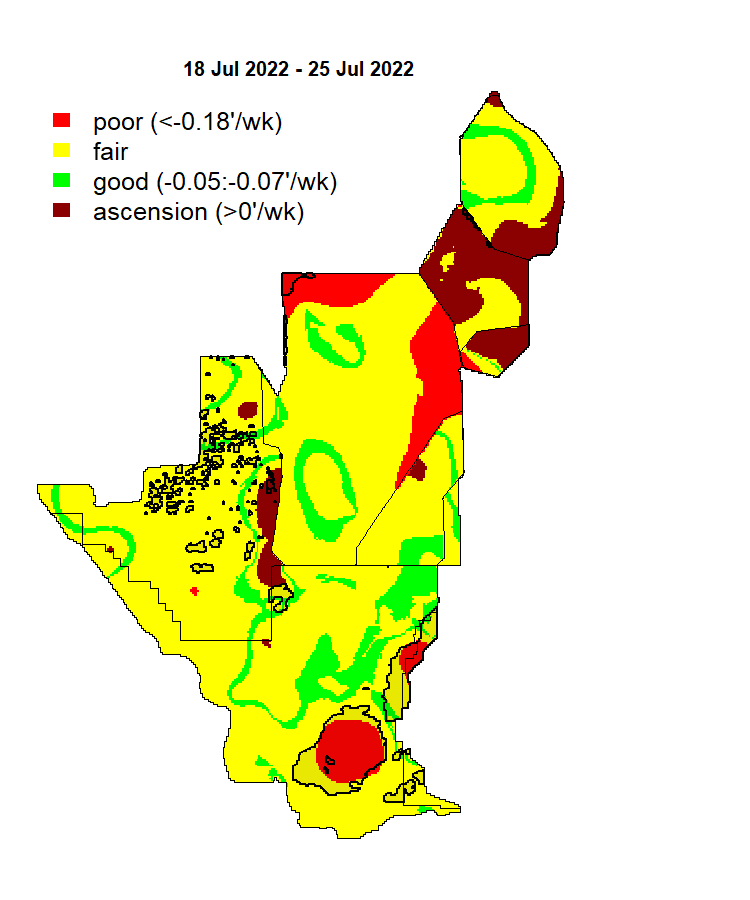
Figure 1. Recession rates (inches/week; right side) and categorizations (left) based on Everglades Ecosystem-Based Management recommendations. Semi-transparent gray polygons highlight areas where the water table is below the soil surface. Clear polygons highlight areas with water depths between 14-30 cm, considered optimal for wading birds.
Water Conservation Areas

Figure 2. Observed and forecast water levels at gauge 3AS3W1 (inset map). Distribution of future water levels predicted by EverForeCast simulations (colored lines), along with observed water levels (black line). Horizontal line shows the dry season high water target (objective: stage <9.2 ft NGVD29 from April 15 to May 31).
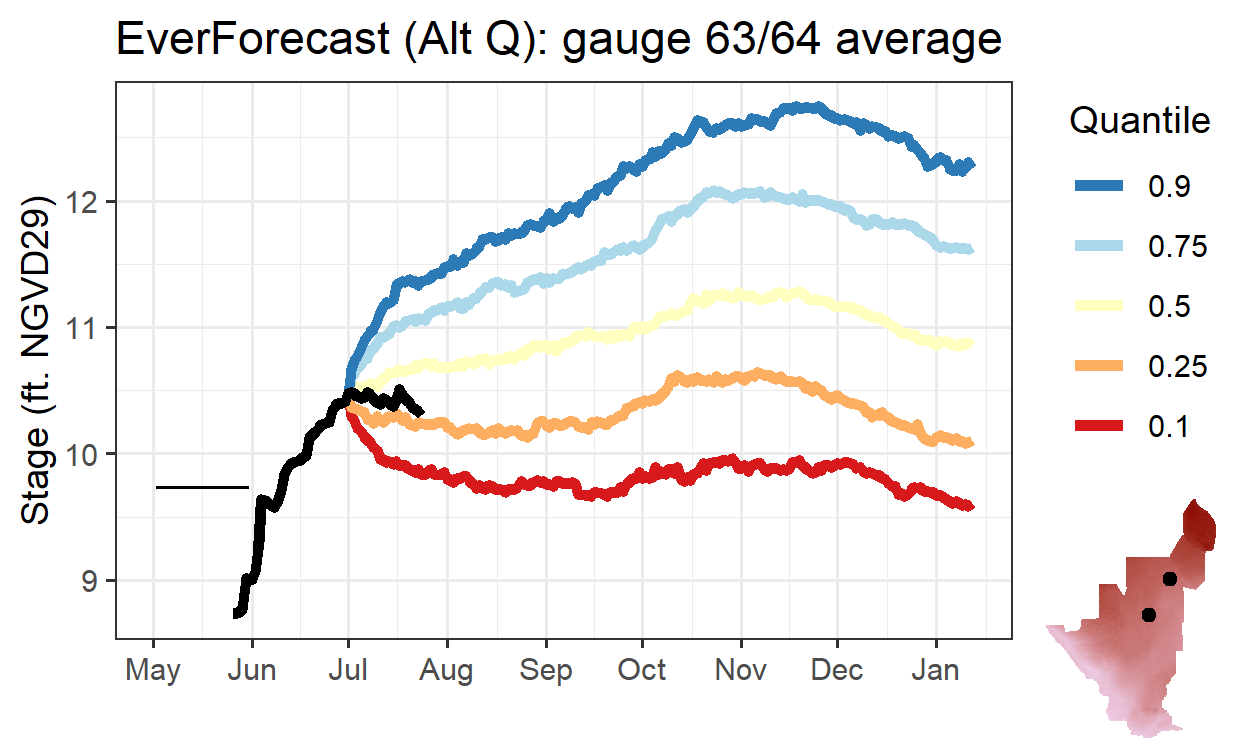
Figure 3. Observed and forecast water levels at gauges 63/64. The Wood stork target (horizontal line) indicates the objective of maintaining stage <9.73 feet NGVD29 between March 1 and May 31. Note: 0.25 quantile reaches 9.73 on 29 March.
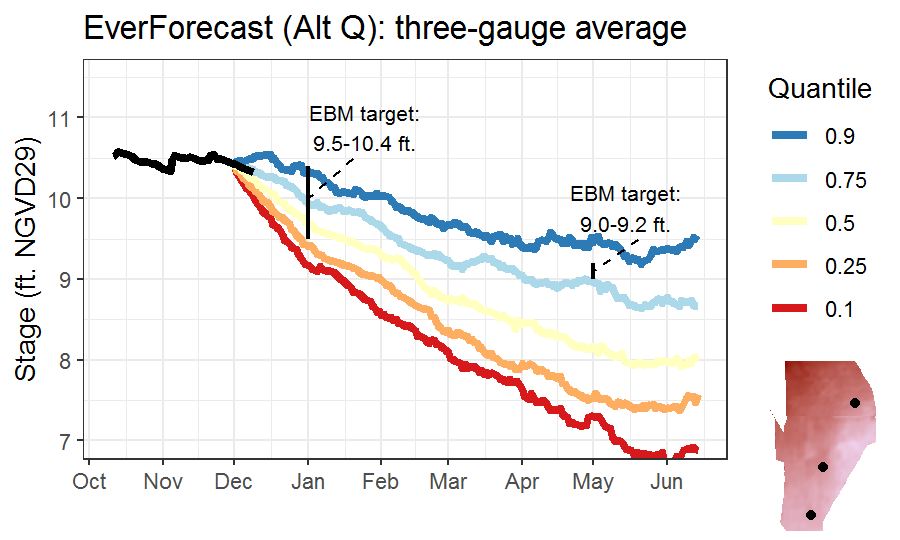
Figure 4. Observed and forecast water levels at the three gauge average in WCA3A. Mean GSE: 8.4’ NGVD29
Everglades and Big Cypress

Figure 5. Observed and forecast water levels at NP-205. Note different quantiles than in previous figures. EverForecast data were smoothed and all data were corrected to align with water levels measured directly at the gauge.
Biscayne National Park
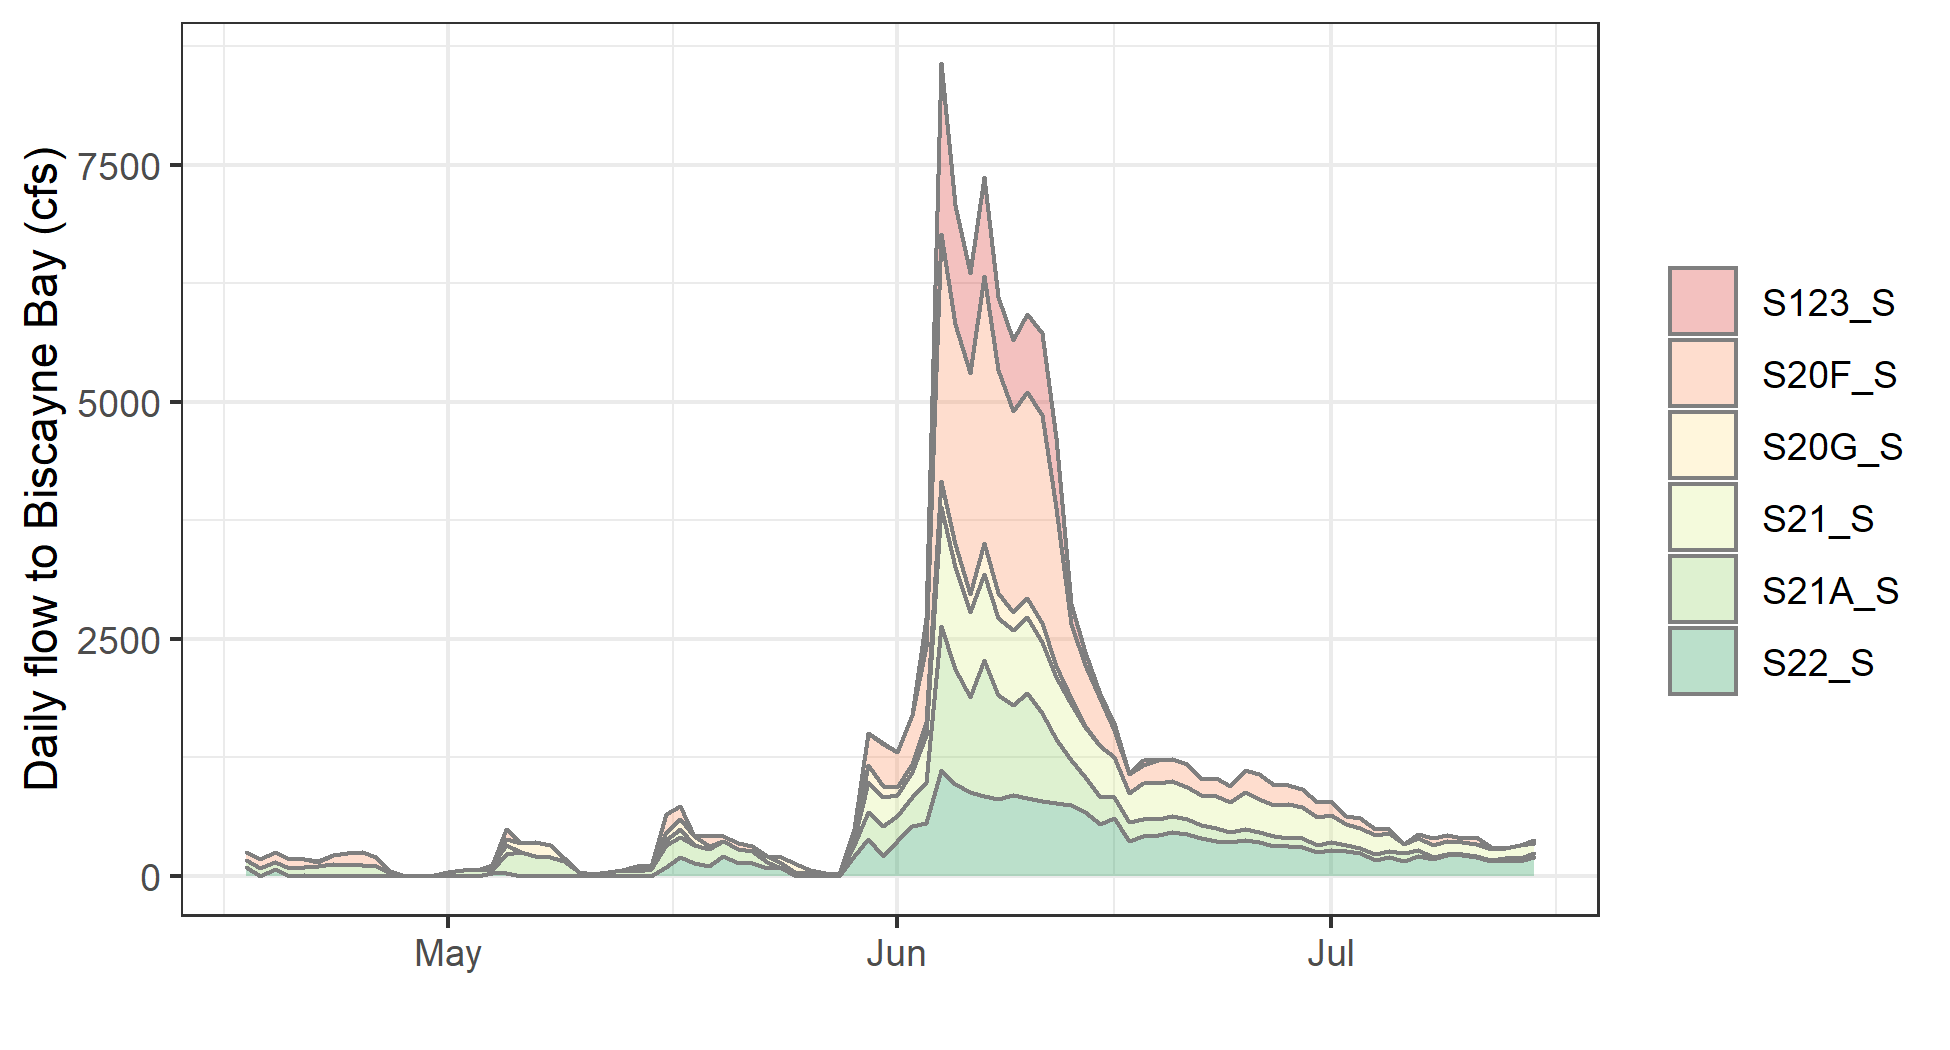
Figure 6. Recent structure flow into Biscayne National Park (and S-22, just north of Biscayne National Park). Overlaid black lines indicate the 25th, 50th, and 75th percentiles for daily flows since 2001.